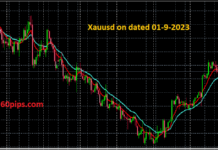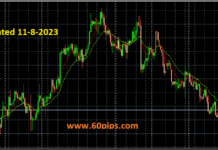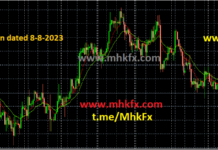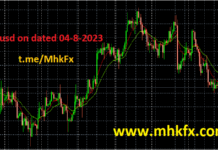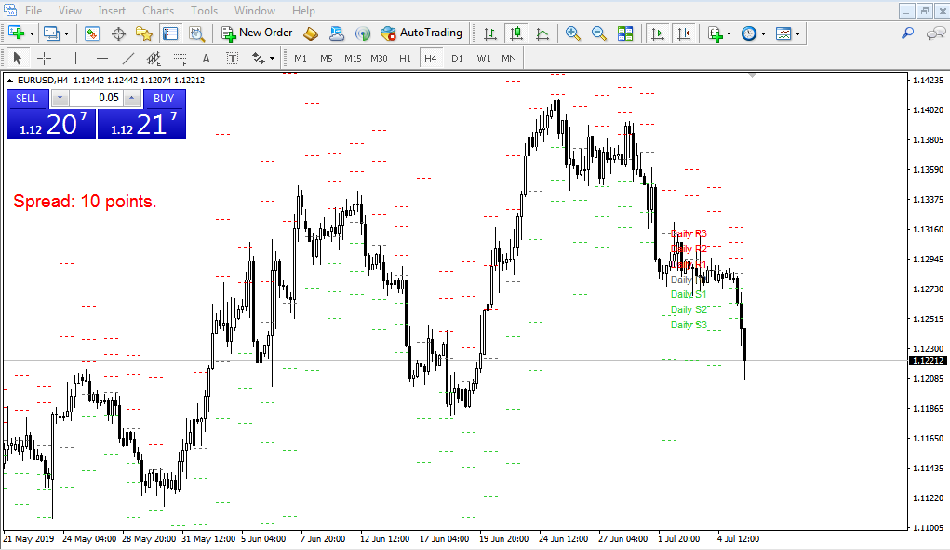
The Bollinger Band is a popular technical indicator in the foreign exchange market. It consists of a moving average (usually the 20-day moving average) and two standard deviation lines, one above and one below the moving average. The upper band represents the upper standard deviation line, while the lower band represents the lower standard deviation line. The bands will expand and contract as the price of the currency pair moves.
When the price of a currency pair is moving within the Bollinger Bands, it is considered to be in a period of low volatility. Conversely, when the price of a currency pair is moving outside of the Bollinger Bands, it is considered to be in a period of high volatility. A break above the upper Bollinger Band is often considered to be a buy signal, while a break below the lower Bollinger Band is often considered to be a sell signal.
The Bollinger Band can also be used to identify overbought and oversold conditions in the market. When the price of a currency pair is trading near the upper band, it is considered to be overbought and a potential sell signal. Conversely, when the price of a currency pair is trading near the lower band, it is considered to be oversold and a potential buy signal.
The Bollinger Band can also be used in conjunction with other technical indicators to provide a more complete picture of the market. For example, it can be used in conjunction with the Relative Strength Index (RSI) to identify potential buy and sell signals. The RSI can be used to confirm a buy signal when the price of a currency pair is trading near the lower band and the RSI is also in oversold territory.
In addition, Bollinger Bands can also be used to identify price trends. When the currency pair is trading within the Bollinger Bands, it is considered to be in a period of consolidation, and no clear trend is present. Conversely, when the price of a currency pair is trending higher and consistently moving above the upper Bollinger Band, it is considered to be in an uptrend. When the price of a currency pair is trending lower and consistently moving below the lower Bollinger Band, it is considered to be in a downtrend.
Overall, the Bollinger Band is a versatile technical indicator that can be used to identify potential buy and sell signals, overbought and oversold conditions, and price trends in the foreign exchange market. It is important to keep in mind that while Bollinger Bands can be a useful tool, it should be used in conjunction with other indicators and not relied on solely to make trading decisions.

