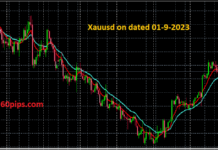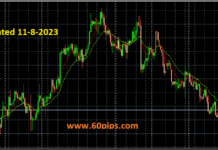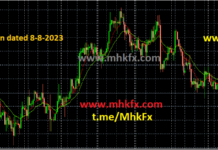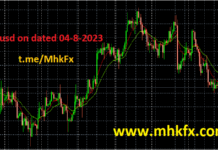
In the markets, gold is traditionally seen as a safe haven asset. This is because it doesn’t experience the same volatility as other assets, and it has been a reliable store of value over the years. When analyzing gold using technical analysis, you can use indicators like the Relative Strength Index (RSI) to determine whether the market is overbought or oversold. You can also look at price trends to see if there’s any indication that the price is about to change direction. Xauusd Live Chart is available in our Telegram free channel.
If you’re looking to invest in gold, then it’s important to keep an eye on these indicators so that you can make informed decisions about when and how to buy. Please follow the instructions for xauusd tradingview (xauusd live chart)-
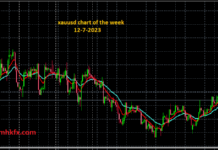
- The bullish engulfing candle on the daily chart is positive for sentiment.
- Posted a Double Bottom formation.
- This is a bullish reversal signal and the lack of progress lower has confirmed a sentiment shift.
- Further upside is expected although we prefer to buy into dips close to the 1708.00 level.
Recommendations: Buy/Buy limit @ 1708 Target/TP: 1738
Related Post:
usdjpy technical analysis on dated 06-01-2023

