The Triangle Breakout Strategy is a popular technical analysis tool used by traders to identify potential trading opportunities. This strategy can be applied to various markets, including stocks, forex, and commodities. In this article, we will discuss tips and tricks for mastering the Triangle Breakout Strategy for successful trading.
Explanation of the Triangle Breakout Strategy
The Triangle Breakout Strategy is a trading strategy that involves identifying triangle patterns on a chart. The triangle pattern is formed by drawing trendlines that connect the highs and lows of the price action. Traders use this pattern to predict potential breakouts or breakdowns in price.
Importance of the Triangle Breakout Strategy in Trading
The Triangle Breakout Strategy is essential for traders because it can help them identify potential trading opportunities. Traders can use this strategy to determine entry and exit points, set stop loss and take profit levels, and manage risk effectively.
The Three Types of Triangles
There are three types of triangles that traders need to be aware of when using the Triangle Breakout Strategy.
Symmetrical Triangle
A symmetrical triangle is a triangle pattern where the price is consolidating between two converging trendlines. This pattern indicates that the market is undecided about the direction of the trend and can result in a breakout in either direction.
Ascending Triangle
An ascending triangle is a triangle pattern where the price is consolidating between a horizontal resistance level and an ascending trendline. This pattern indicates that the buyers are in control, and the price is likely to break out to the upside.
Descending Triangle
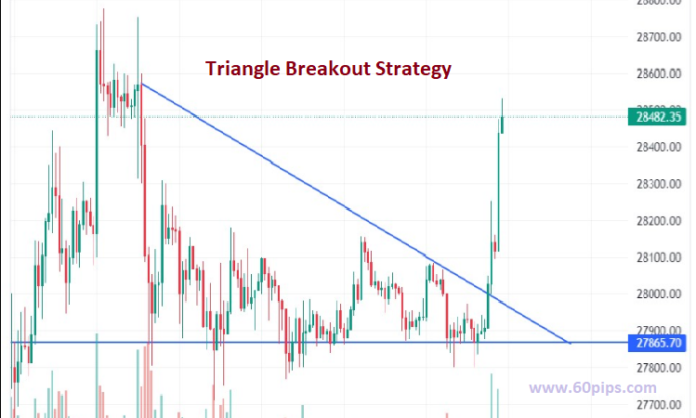
A descending triangle is a triangle pattern where the price is consolidating between a horizontal support level and a descending trendline. This pattern indicates that the sellers are in control, and the price is likely to break out to the downside.
How to Identify a Triangle Pattern
To identify a triangle pattern, traders need to draw trendlines that connect the highs and lows of the price action.
Drawing Trendlines
When drawing trendlines, traders need to ensure that they connect at least two highs and two lows. This will create a triangle pattern that indicates a potential breakout.
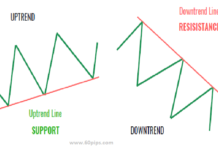
Determining Support and Resistance Levels
Traders also need to determine the support and resistance levels within the triangle pattern. This will help them identify potential entry and exit points for their trades.
Trading the Triangle Breakout Strategy
Wait for the Breakout
Traders should wait for the breakout before entering a trade. This will confirm the direction of the trend and reduce the risk of false breakouts.
Set Stop Loss and Take Profit Levels
Traders should also set stop loss and take profit levels to manage their risk effectively. Stop loss levels should be placed below the breakout level for long trades and above the breakout level for short trades.
Manage Risk with Position Sizing
Traders should also manage their risk by using proper position sizing. This involves determining the appropriate amount of capital to risk on each trade. The general rule of thumb is to risk no more than 2% of your trading account on any given trade.
For example, if you have a $10,000 trading account, you should only risk $200 per trade. This will help you avoid blowing up your account in the event of a losing streak.
Tips and Tricks for Successful Trading
Avoid Trading Within the Triangle
Traders should avoid trading within the triangle pattern. This is because the price is consolidating within the pattern, and there is no clear trend direction. Trading within the triangle can result in false breakouts, which can lead to significant losses.
Confirm the Breakout with Other Indicators
Traders should also confirm the breakout with other indicators. This can include volume, momentum indicators, or other technical analysis tools. Confirming the breakout with other indicators can help increase the accuracy of the trade and reduce the risk of false breakouts.
Consider the Timeframe of the Triangle
Traders should also consider the timeframe of the triangle pattern. A longer timeframe triangle pattern is more significant than a shorter timeframe pattern. This is because a longer timeframe pattern indicates a more significant price consolidation and potential breakout.
Conclusion
In conclusion, the Triangle Breakout Strategy is a powerful tool for traders to identify potential trading opportunities. Traders can use this strategy to determine entry and exit points, set stop loss and take profit levels, and manage risk effectively. By mastering the Triangle Breakout Strategy and implementing these tips and tricks, traders can increase their chances of successful trading.
