A basic technical trading guide for XAU/USD, which represents the exchange rate between gold (XAU) and the US dollar (USD). Keep in mind that trading involves risks, and it’s important to conduct thorough research and consider professional advice before making any trading decisions. This guide will cover some common technical analysis tools and concepts used in trading XAU/USD:
Candlestick Patterns:
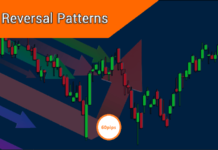
Candlestick patterns provide insights into price movements. Patterns like doji, hammer, shooting star, and engulfing patterns can signal potential reversals or continuation of trends.
Trendlines:
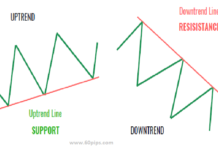
Draw trendlines to identify the overall trend. An uptrend can be drawn by connecting higher lows, while a downtrend can be drawn by connecting lower highs. Trendlines can act as support or resistance levels.
Support and Resistance Levels:
Identify key support and resistance levels where price tends to stall or reverse. These levels can be identified using past price action or tools like pivot points.
Moving Averages:
Moving averages smooth out price data and help identify trends. The 50-day and 200-day moving averages are commonly used. A crossover of these moving averages can indicate potential trend changes.
Relative Strength Index (RSI):
The RSI measures the speed and change of price movements. An RSI above 70 might indicate overbought conditions, while an RSI below 30 might indicate oversold conditions.
MACD (Moving Average Convergence Divergence):
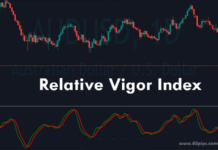
The MACD is a trend-following momentum indicator that shows the relationship between two moving averages of a security’s price. Crossovers and divergences can be used to identify potential trading signals.
Fibonacci Retracements:
These levels help identify potential support and resistance levels based on key Fibonacci ratios. They are often used to predict potential price reversals during a trend.
Chart Patterns:
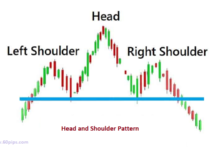
Patterns like head and shoulders, double tops, and double bottoms can provide insights into potential trend reversals.
Volume Analysis:
Volume can provide confirmation for price movements. Increasing volume during a trend indicates strong conviction, while decreasing volume might suggest a weakening trend.
Divergence:
Look for divergence between price and oscillators (like RSI or MACD). Bullish divergence occurs when price makes lower lows but the oscillator makes higher lows, suggesting a potential reversal.
Remember that these tools are not foolproof and should be used in conjunction with each other and with a solid risk management strategy. Always practice prudent risk management by setting stop-loss orders and not risking more than you can afford to lose. Additionally, staying updated with economic and geopolitical news that might impact gold prices is crucial.
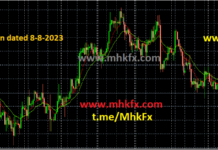
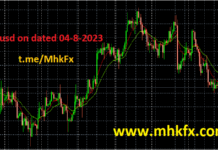
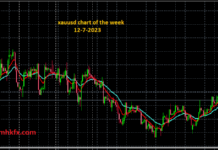
Lastly, consider demo trading to practice your strategies before committing real capital, and consider seeking advice from experienced traders or financial professionals before making trading decisions. Today’s intraday overview as follows:
- Price action has formed an expanding wedge formation.
- Trend line support is located at 1910.
- Bespoke resistance is located at 1948.
- The previous swing high is located at 1947.
- Although the anticipated move lower is corrective, it does offer ample risk/reward today.
Recommendations: Buy/Buy limit @ 1915 Take Profit: 1932
Alternative: Sell limit @ 1932 Take Profit: 1910
Read more : Xauusd Technical Analysis on Dated 9-02-2023

