In the dynamic world of financial markets, traders are always on the lookout for effective tools and indicators that can provide them with insights into market trends and potential reversals. One such tool that has gained significant popularity among traders is the Relative Vigor Index (RVI). The RVI is a technical indicator that has proven to be a powerful ally in identifying trend reversals. In this article, we will explore why traders are embracing the RVI and how it helps them in their decision-making process.
Understanding the Relative Vigor Index (RVI)
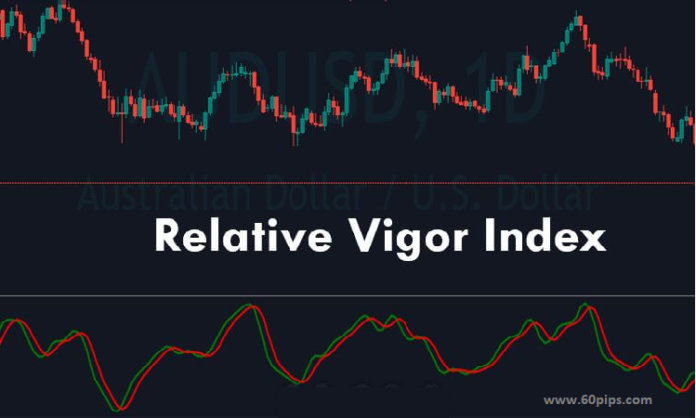
The Relative Vigor Index is a momentum oscillator that measures the conviction behind price movements in the market. Developed by John Ehlers, the RVI compares the closing price of an asset to its trading range over a specified period. It calculates the relationship between the closing price and the range between the high and low prices. By doing so, it provides traders with insights into the strength and direction of price movements.
Identifying Trend Reversals
One of the key reasons traders are turning to the RVI is its ability to identify potential trend reversals. By analyzing the RVI, traders can detect shifts in momentum that often precede changes in price direction. The RVI generates signals based on bullish and bearish divergences, crossovers, and overbought/oversold conditions. These signals act as early warning signs of potential trend reversals, allowing traders to make timely and informed trading decisions.
Bullish and Bearish Divergences
The RVI compares the direction of the indicator with the direction of the price movement. When the RVI and price movement diverge, it suggests a weakening trend and the possibility of a reversal. Bullish divergences occur when the price makes lower lows while the RVI makes higher lows, indicating potential upward momentum. Conversely, bearish divergences occur when the price makes higher highs while the RVI makes lower highs, indicating potential downward momentum.
Crossovers
The RVI also utilizes crossovers between its signal line and the centerline to identify trend reversals. When the RVI crosses above the centerline, it generates a bullish signal, indicating potential upward momentum and a reversal from a downtrend. Conversely, when the RVI crosses below the centerline, it generates a bearish signal, suggesting potential downward momentum and a reversal from an uptrend.
Overbought and Oversold Conditions
The RVI also helps traders identify overbought and oversold conditions in the market. When the RVI reaches extreme levels, such as above 70 or below 30, it indicates that the market may be overextended and due for a reversal. Traders can use these levels as signals to enter or exit trades.
The Power of Timely Decision-Making
The RVI’s ability to identify trend reversals gives traders a significant advantage in the market. By detecting shifts in momentum early on, traders can position themselves ahead of potential price reversals and capitalize on profitable opportunities. It allows them to enter trades at favorable prices, minimize risk, and potentially maximize their profits.
Conclusion
Traders have embraced the Relative Vigor Index (RVI) as a powerful tool for identifying trend reversals. Its ability to detect divergences, crossovers, and overbought/oversold conditions gives traders valuable insights into market dynamics. By using the RVI, traders can make informed and timely decisions, positioning themselves to take advantage of potential trend reversals. However, like any technical indicator, it is essential to use the RVI in conjunction with other analysis tools and risk management strategies for optimal results.
Related Post:
All about RSI as Forex Indicator

