The Head and Shoulders pattern is a well-known technical chart pattern that can indicate a potential reversal in a stock’s trend. It is a bearish pattern, meaning that it suggests a decline in the price of the stock is likely. In this article, we will discuss what the Head and Shoulders pattern is, how it is formed, and how it can signal a potential bearish reversal in the stock market.
What is the Head and Shoulders Pattern?
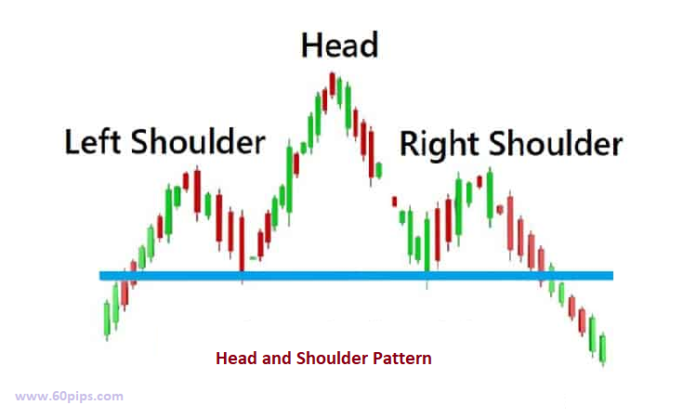
The Head and Shoulders pattern is a technical analysis chart pattern that is used to identify potential reversals in the price trend of a stock. It is formed by three peaks, with the middle peak being the highest (the “head”), and the other two peaks being lower and roughly equal in height (the “shoulders”). The pattern is completed when the price breaks below a “neckline,” which is a trendline drawn across the bottoms of the two troughs between the shoulders and the head.
How is the Head and Shoulders Pattern Formed?
The formation of the Head and Shoulders pattern is a multi-step process that typically takes several weeks or months. Here are the key steps involved:
Step 1: The Left Shoulder – The first peak forms as the price of the stock rises to a new high, followed by a decline to a support level.
Step 2: The Head – The second peak forms when the price rises again to a higher level than the left shoulder, before declining again to the same support level as before.
Step 3: The Right Shoulder – The third peak forms when the price rises again, but this time only to the level of the left shoulder before declining to the same support level.
Step 4: The Neckline – The neckline is drawn across the bottoms of the two troughs between the shoulders and the head.
How Can the Head and Shoulders Pattern Signal a Potential Bearish Reversal?
When this pattern is completed, it can signal a potential bearish reversal in the stock’s trend. This is because the pattern suggests that buyers are losing their momentum, and that sellers are gaining control. When the price breaks below the neckline, it confirms that the bearish momentum has taken over, and the price is likely to continue declining.
Traders and investors who spot this pattern forming may use it as a signal to sell their shares or to go short (betting that the stock’s price will go down) in anticipation of a decline in the stock’s price.
Conclusion
The Head and Shoulders pattern is a popular technical chart pattern that can signal a potential bearish reversal in a stock’s trend. It is formed by three peaks, with the middle peak being the highest (the “head”), and the other two peaks being lower and roughly equal in height (the “shoulders”).
When the price breaks below the neckline, it confirms that the bearish momentum has taken over, and the price is likely to continue declining. Traders and investors who spot this pattern forming may use it as a signal to sell their shares or to go short in anticipation of a decline in the stock’s price.
Related Post:
Forex Patterns : Mastering A Key Reversal Pattern in Trading
The best forex broker


