Technical analysis is a form of market analysis that uses technical indicators to analyze the price movements of securities, commodities, and other assets. These indicators typically include things like volume, price patterns, price volatility, and historical data in order to identify trends and make predictions about asset prices.
Technical analysis was originally developed to help investors make informed decisions by analyzing market data. Today, it is used by both amateur and professional traders to help them make investment decisions. Technical analysts typically use several different indicators to analyze the price movements of an asset. Some of the most common technical analysis indicators include:
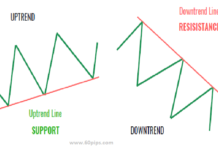
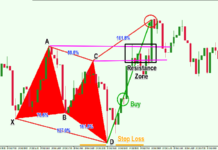
Support levels :
These are areas where the price tends to bounce back after falling. They can provide clues about future price movements and can be used as signals for entering or exiting trades.
Resistance levels :
These are areas where the price tends to break up after rising sharply. They can indicate a period of strong momentum and can be used as signals to take profits or enter new positions.
Momentum :
This is the rate at which an asset is gaining or losing value over time. It can be useful in identifying whether an asset is trending higher or lower overall.-Risk-reward – This refers to how an asset’s potential gains vs. its potential losses change as the price changes. It helps determine whether it’s a good time for you to trade or hold an asset.
Trading volume :
High trading volume indicates high interest in an asset, which can give you confidence in your decision to buy or sell it.-Dollar-cost average (DCA) – This refers to buying small amounts of an asset one at a time over a period of time instead of all at once. It helps reduce risk while still giving you exposure
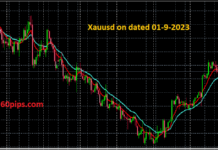
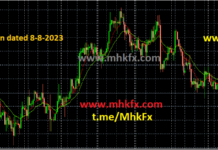
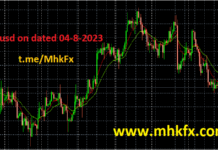
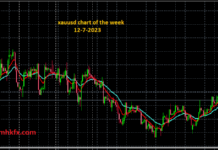
- Inside Soldiers have been posted on the daily chart.
- Trading within a Corrective Channel formation.
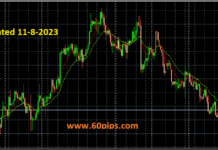
- Intraday, and we are between bespoke support and resistance 1843-1895.
- The 261.8% Fibonacci extension is located at 1841 from 1886 to 1868.
- Further downside is expected and we prefer to set shorts in early trade.
Recommendations: Sell/Sell limit @ 1884 TP/Target: 1864


