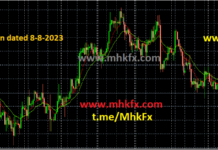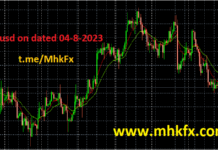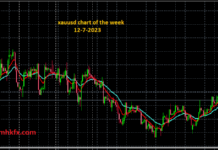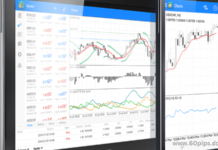
Technical analysis is a method used in finance and trading to forecast the future price movements of financial assets, such as stocks, currencies, commodities, and cryptocurrencies. It is based on the premise that historical price and volume data can provide insights into future price movements and trends. Technical analysts, often referred to as chartists, use various tools and techniques to analyze past market data and make predictions about future price directions. Here are some key elements of technical analysis:
Price Charts: Technical analysts primarily use price charts to visualize historical price data. Common chart types include line charts, bar charts, and candlestick charts. These charts display the asset’s price over time, allowing analysts to identify patterns and trends.
Patterns and Trends: Technical analysts look for patterns and trends in price charts, such as head and shoulders, double tops and bottoms, flags, triangles, and more. These patterns are believed to repeat over time and can indicate potential future price movements.
Indicators and Oscillators: Technical analysts use various technical indicators and oscillators, such as moving averages, Relative Strength Index (RSI), Moving Average Convergence Divergence (MACD), and Stochastic Oscillator, to generate buy and sell signals. These indicators are often used to confirm or validate chart patterns and trends.
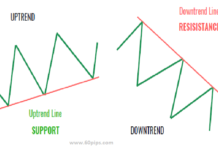
Support and Resistance Levels: Support levels are price levels at which an asset tends to find buying interest, preventing it from falling further. Resistance levels are price levels at which an asset encounters selling pressure, preventing it from rising further. Technical analysts identify these levels to make trading decisions.
Volume Analysis: Trading volume is a crucial aspect of technical analysis. Changes in trading volume can provide insights into the strength or weakness of a price trend or reversal.
Time Frames: Technical analysis can be applied to various time frames, from intraday charts for short-term trading to daily, weekly, or monthly charts for longer-term investing. The choice of time frame depends on the trader’s or investor’s goals.
Dow Theory: Charles Dow, a pioneer in technical analysis, developed the Dow Theory, which forms the foundation of much technical analysis. It emphasizes the idea that market price action reflects all available information and that price movements are driven by a combination of primary trends (long-term), secondary trends (intermediate-term), and minor trends (short-term).
It’s important to note that technical analysis is a subjective approach to market analysis, and its effectiveness is a subject of debate among traders and investors. Critics argue that it relies on historical data and patterns that may not always repeat, and that it doesn’t take into account fundamental factors like company financials or economic data. Supporters, on the other hand, believe that technical analysis can provide valuable insights and is a useful tool when combined with other forms of analysis.
Ultimately, whether or not to use technical analysis depends on an individual’s trading or investment strategy and their belief in its efficacy. Many traders use a combination of technical analysis and fundamental analysis to make informed decisions in financial markets.
Click to sign up with ICMarkets
Related Articles:
The Psychological Pitfalls of Forex Trading : Overcoming Fear, Greed, and Emotion in the Market

